We have enhanced some of the long-standing statistical screens that you and your team are familiar with, not only in the look and feel, but also with the addition of bar and pie charts for visual representation.
Below is the list of Menus that have been redesigned, users will find the existing version relabelled as ‘Classic’ and still available within the main menu:
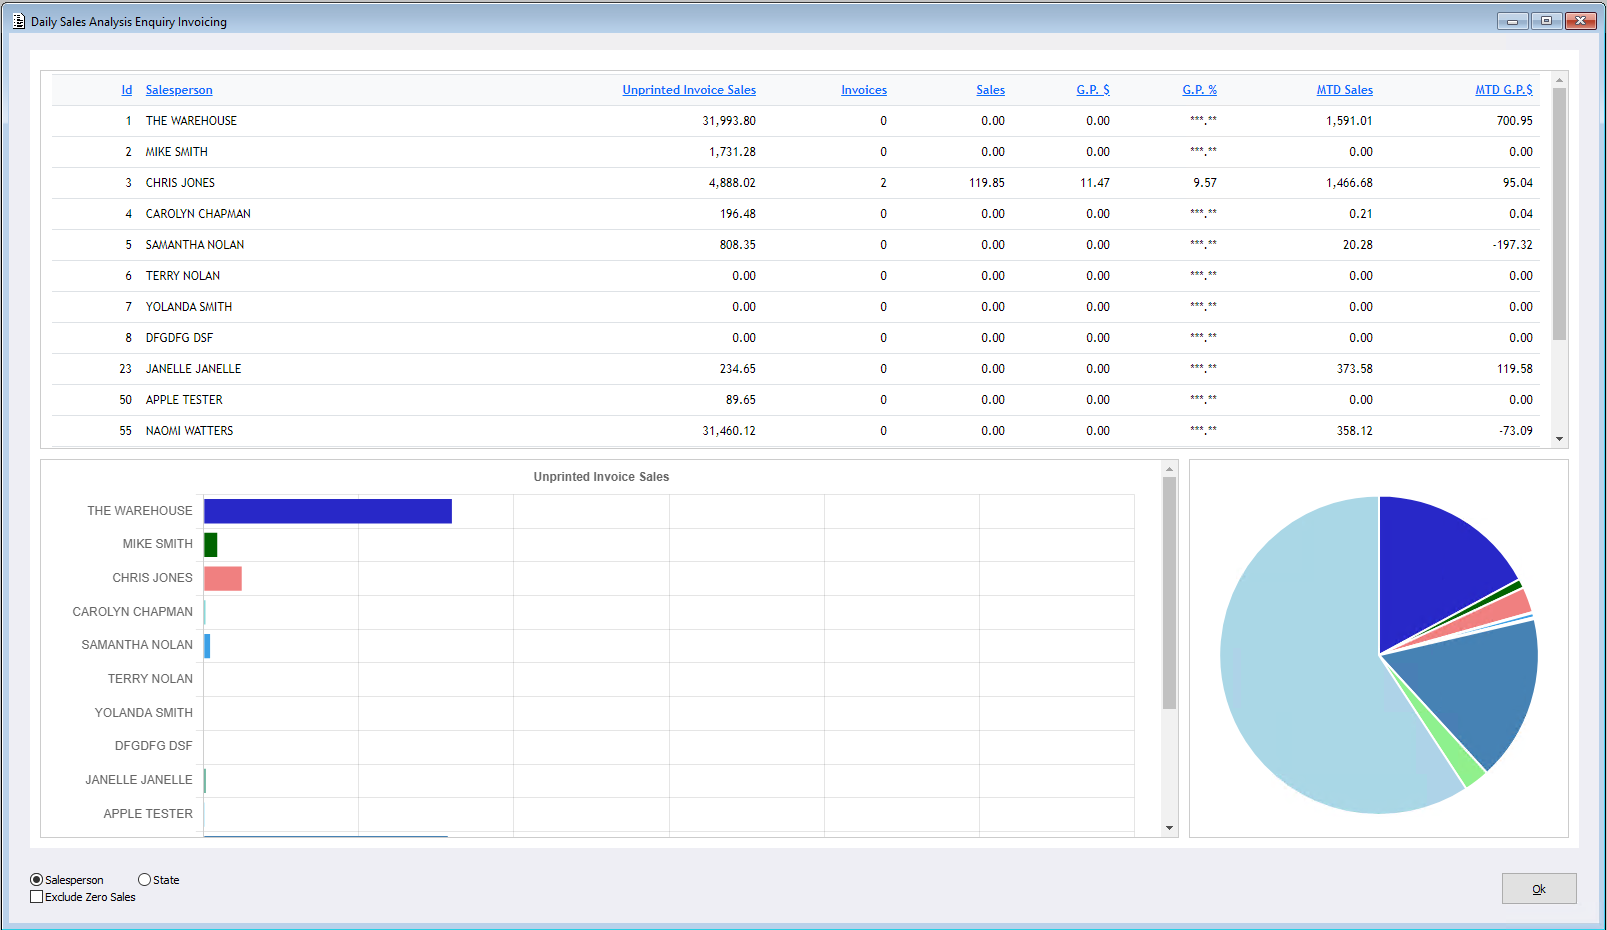
- Daily Sales Analysis Enquiry
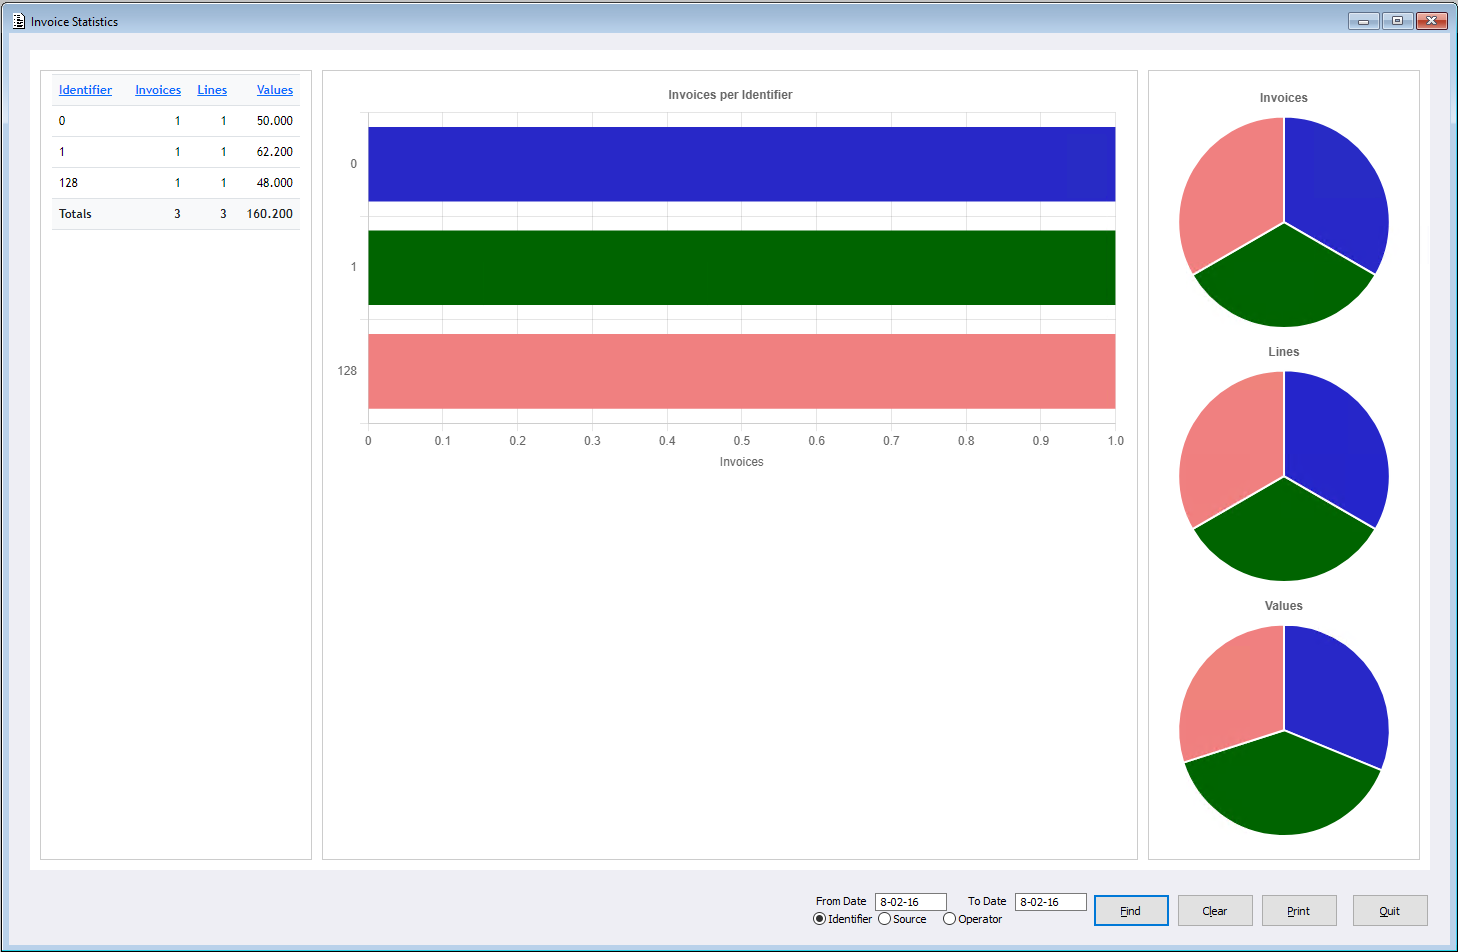
- Invoice Statistics
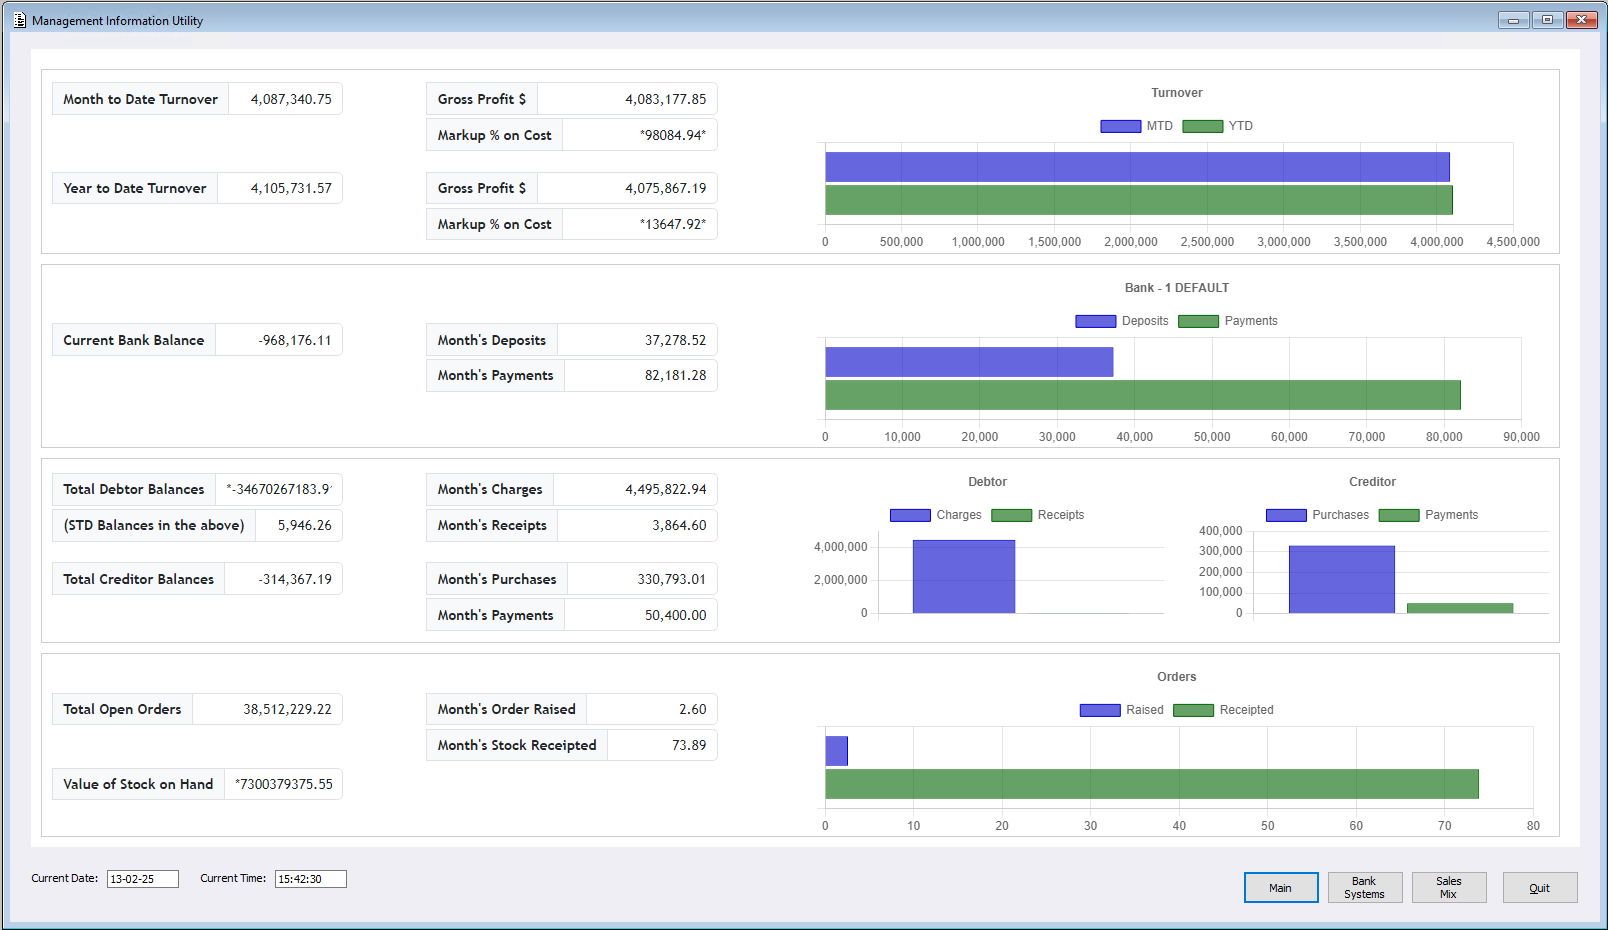
- Management Information Utility
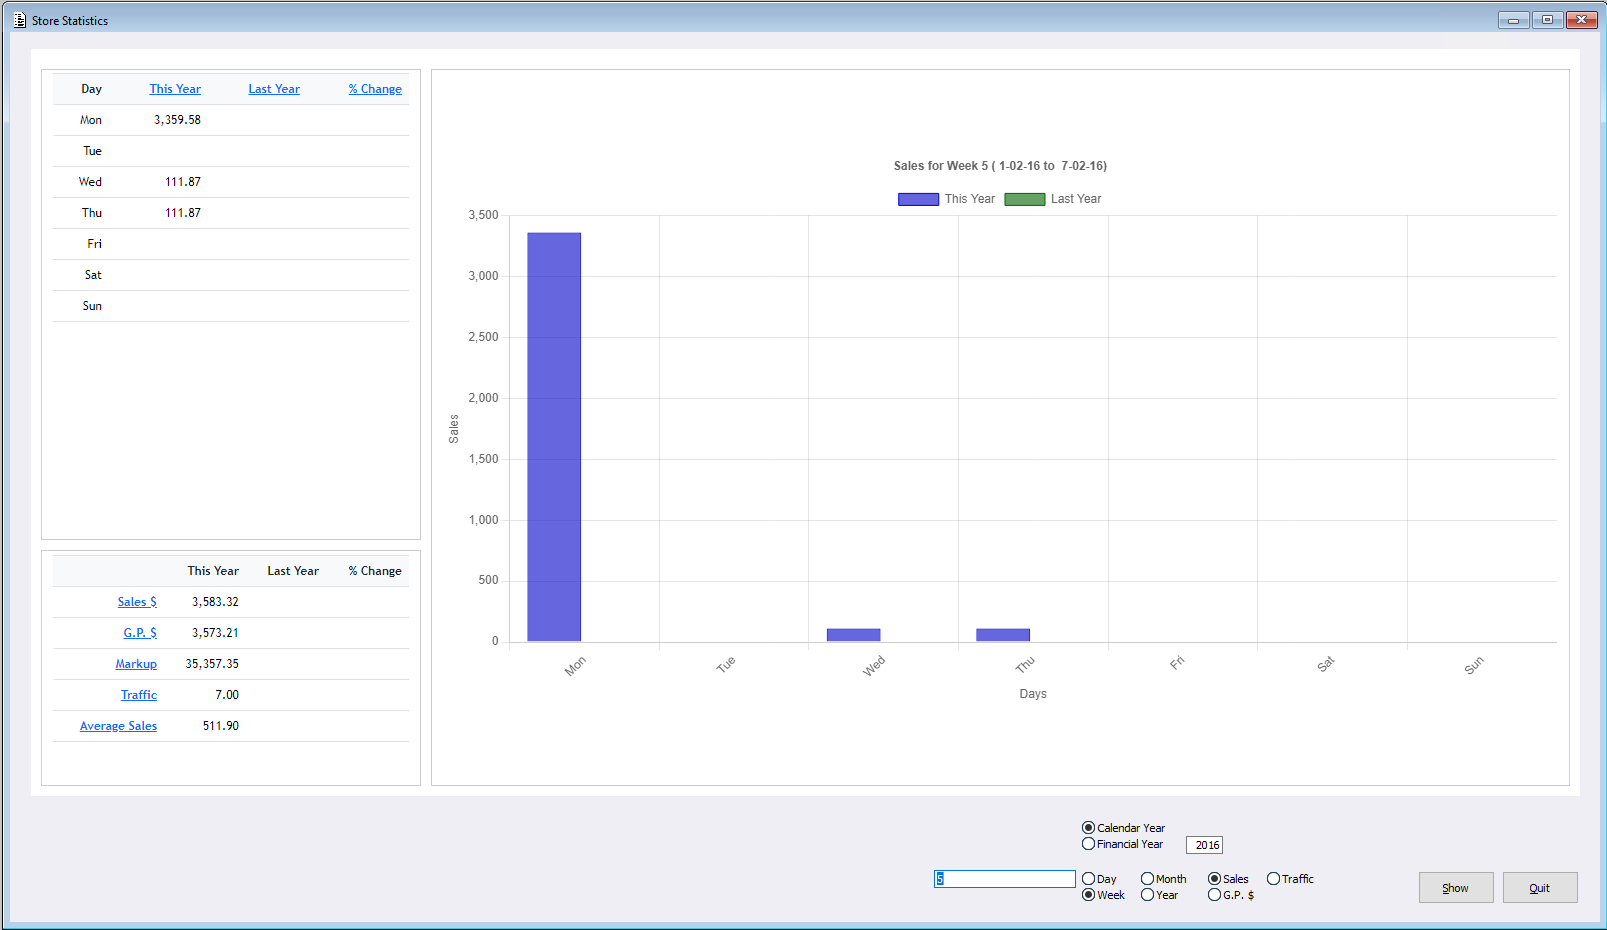
- Store Statistics
Whilst the core functionality and the data used within these menus remains consistent, Users will note that the Headers of the data columns are now sortable, providing improved functionality.
Note: Existing Menu Security for these menus will carry over onto the new versions. Any changes to the Classic and Current versions will share the same changed settings.
Please see the below examples:
- Daily Sales Analysis Enquiry
- Invoice Statistics
- Management Information Utility
- Store Statistics